This page sponsored by Pacific West Sportfishing and the Hotel Los Barriles.
Using SST maps: The key to getting the most out of SST observations is realizing that the raw water temperatures are less important than changes in water temperature. Remember that the ocean is three-dimensional, and that the correlation of surface temperature (where the sun and wind play a big effect) with deep water temperature (governed by deep ocean currents) is indirect, at best. And while we catch species such as tuna and marlin on or near the surface, the fact is that these species do much of their living and hunting in deeper water. In fact, these species have some capability to control their body temperatures (i.e., they're not completely cold-blooded), which they need to thrive in colder deep water. So their activity level is less correlated to water temperature than you might think.
Changes in water temperature, however, are a very good indicator of water activity, i.e., currents, upwellings, etc. Moving water carries nutrients, which fosters plankton growth, which brings the baitfish, which brings the gamefish. No big mystery, just the follow the food chain.
There are two key SST features to look for. The first (and most obvious) is the temperature break, which is sharply defined boundary between regions of two different water temperatures. This indicates horizontal water movement, and the important aspect is that the area defined by the break is generally the boundary between different currents moving at different speeds, resulting in slack water between. This slack region tends to collect nutrients and plankton, thus attracting baitfish, etc. On the water, you can actually see these slack areas as "corridors" of different colored water, some times containing scum lines.
Ever wondered how your skipper decides to throttle down and troll when forty miles offshore? Oftentimes they're driving until they spot a current break, and then troll back and forth across it.
The second feature to look for is "boiling", where there's lots of small-scale temperature variability in a region. The water isn't really boiling, of course. The churning evidenced by this feature is a result of vertical water movement, or upwelling. Upwellings bring nutrient rich water from the ocean floor to the surface, and off we go down the food chain again. The actual locations of the breaks themselves are less important here, as they're not very stable anyway. Gamefish will often be scattered throughout the region showing this type of water activity.
Inshore, the above can apply as well, but since we're now talking shallow water, the surface temperature is more closely related to that of the fish's environment. To boot, inshore species (like pargo and roosterfish) are cold-blooded, and so when the water cools off, they slow down. These "home guard" fish also seem to be sensitive to sudden changes in water temperature, whether warmer or colder. Often, a few-degree change over a period of a day or two will cause the fish to lay low. They'll go back on the feed once the water temperature stabilizes again.
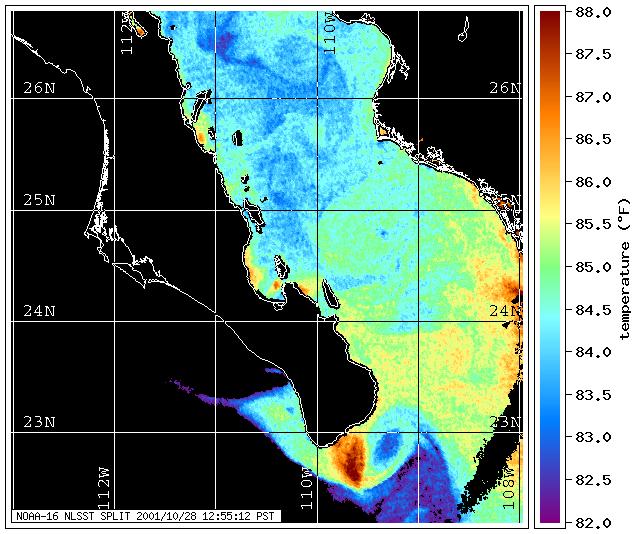
This image was obtained from the CoastWatch West Coast Regional Node, supported by the NOAA CoastWatch program.
|
|